Investment Funds market exposure strategies can be categorized primarily into three types.
Type 1: Long only strategy: funds that buy and hold positions.
Type 2: Short only strategy: funds that primarily borrow and short shares
Type 3: Market neutral strategy: funds that hold half their position in long and half their positions in short attempting to gain from some form of arbitrage between performers and losers.
To increase profit funds would typically be leveraged. Levels of leverage is dependent on how aggressive each individual fund is. Long Term Capital Management for example, a fund that went bankrupt in 1998, was leveraged up to 20X for some of its positions.
During a recent frenzy co-ordinated efforts by Redditers bid up prices of stock symbols like GameStop and AMC. From a fund management perspective, funds belonging to Type 2 and Type 3 were heavily impacted by this black swan event. As losses in their short positions mounted, many received margin calls from their lenders.
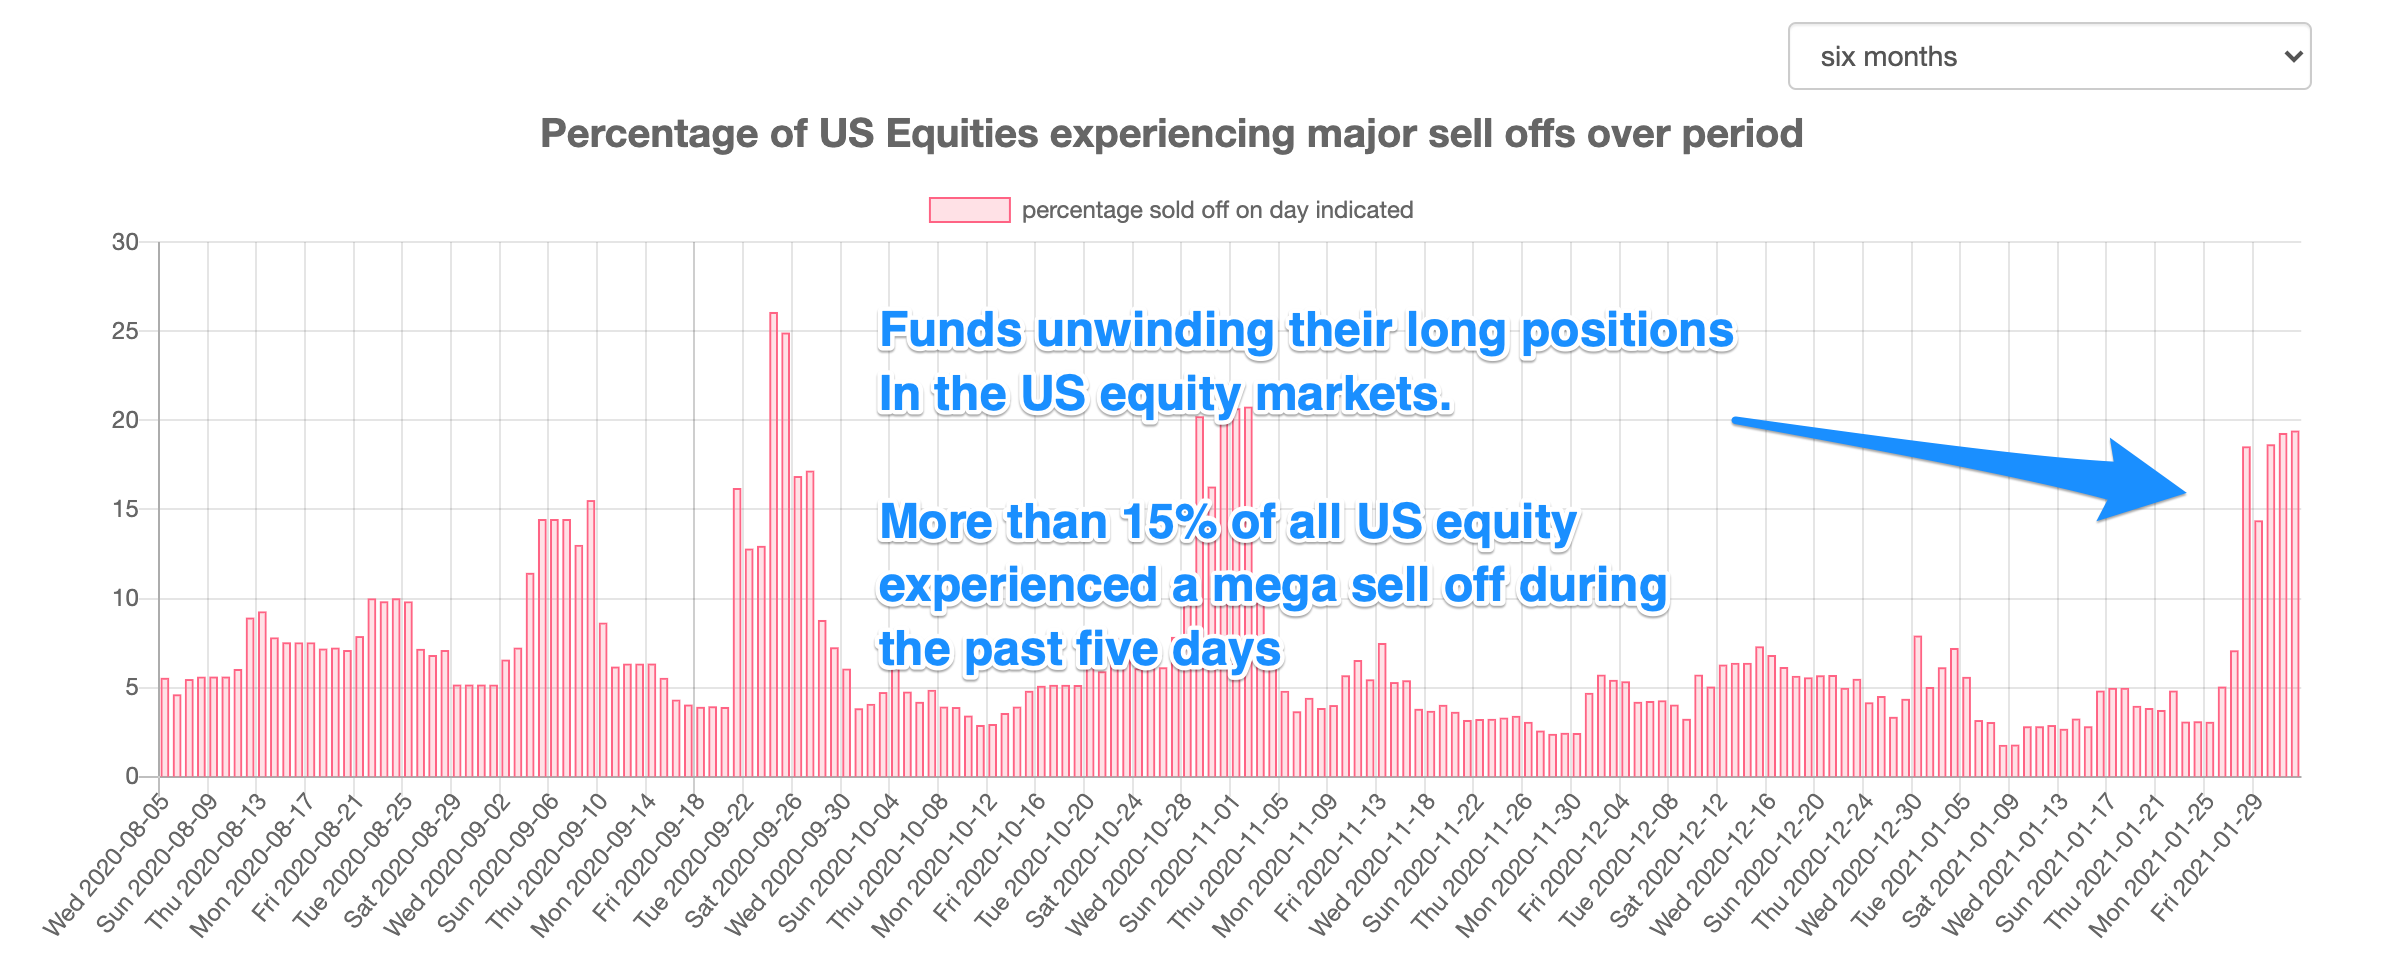
It is likely that Type 3 unwinded the bulk of their long positions to cover their margin calls. This had the net impact of driving down share prices of other unrelated stock symbols as observed in the US Equities sell off chart above.
Depressed share prices due to the unwinding of long positions by Type 3 lead to a follow on cascading effect where Type 1 had to unwind their leveraged long position.

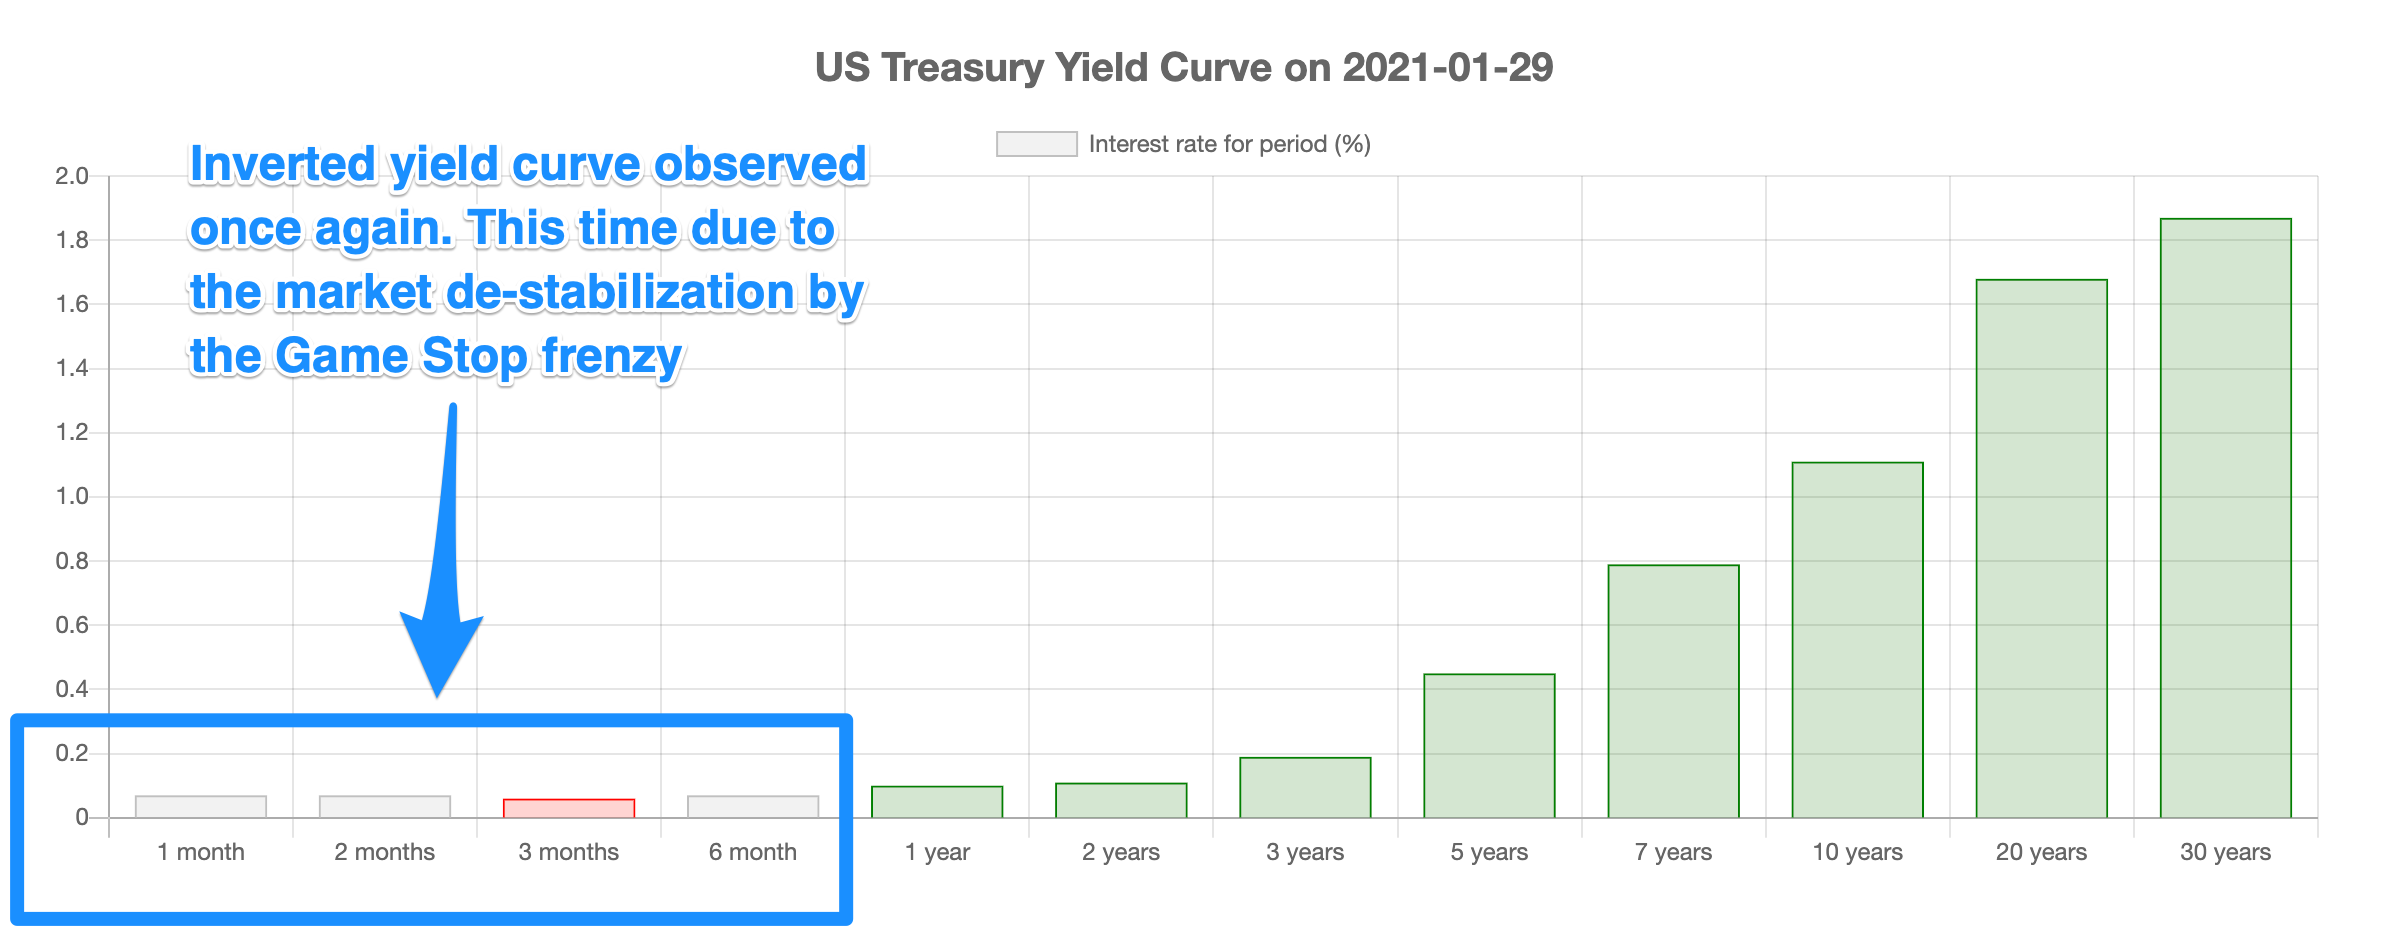
This large scale unwinding activity could be inferred from the inverted yield curve observed on 31st Jan 2021. This inversion could also be interpreted as funds opting to maintain liquidity levels by moving heavily into positions like short term US Treasury and cash as they await for the market gyration to settle.
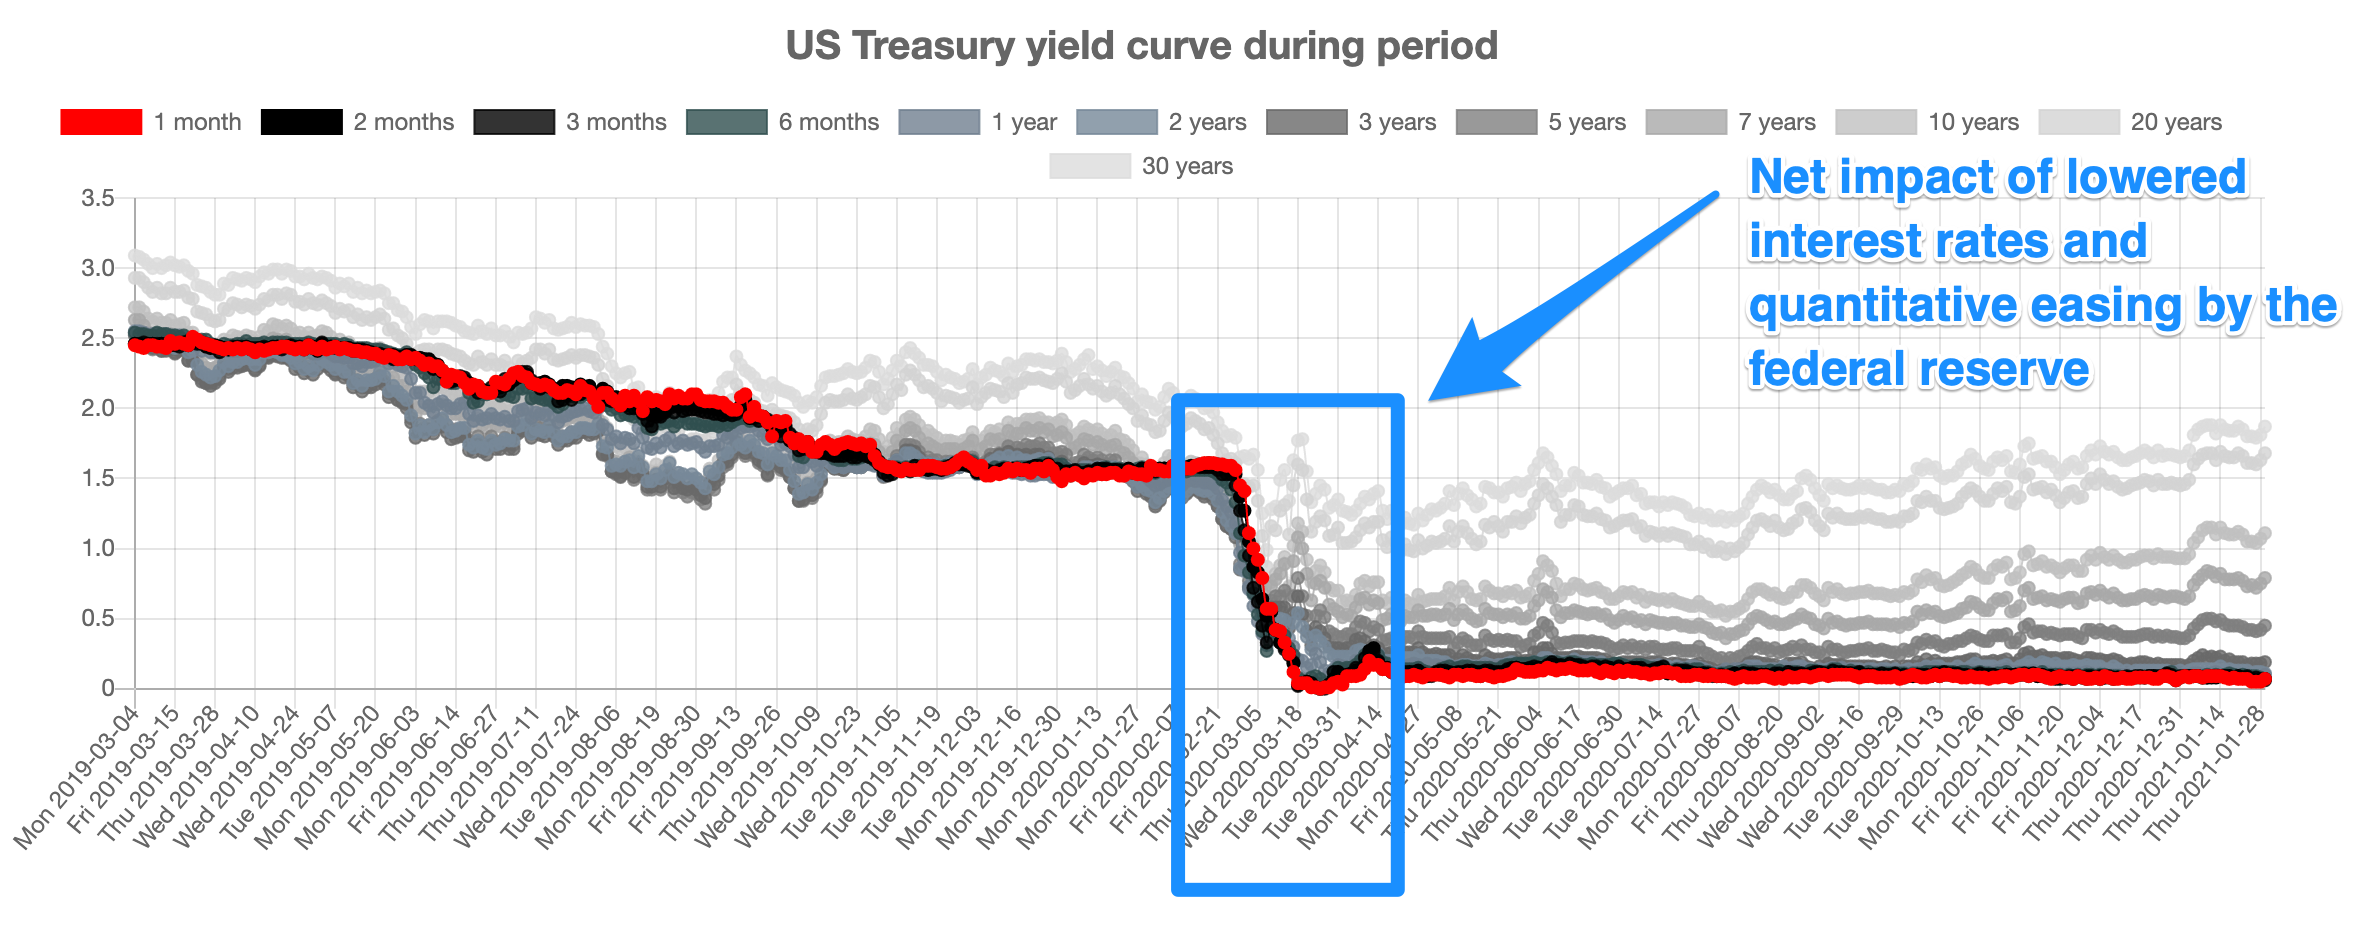
The last time the yield curve was observed to be extremely inverted was on 26th Feb 2020, during the initial onset of the COVID-19, pandemic as illustrated below

That was rectified when the Federal reserve lowered interest rates to 0% and started quantitative easing on 13th March 2020.


