This documentation is an extension on the strategy of loss aversion and reversion to mean. Its aim is to quantitatively identify the point in time when the effects of mass hysteria resultant from bad news has subsided.
For clearer reading of signals, entry should be done at end of day instead of beginning of day.
Heuristics
- Only consider a purchase if there are funds available for deployment
- Only consider companies with my circle of competence.
- To mitigate intraday noise, only execute orders in the last hour of the trading day. Make sure spreads are narrow.
- Only consider entry if the expected value for mean reversion of the company’s industry is above 0.1
- Only consider entry if the expected value for mean reversion of the company’s industry is above 0.2
- Large dip is qualified if RSI was below 30
- Only enter when MACD histogram down trend receeds
- Enter at historical support level
- Exit at 5% capital gain
- Stop loss at 2% capital loss
Successful attempts
Listed below are 3 successful entry attempts during early 2019 where a 5% capital gain were captured.


The key characteristics of these entry were:
- Dip classification
- >10% drop in share price
- Trading volume accompanying large dip should be at least 2.5X of 10 day moving average
- In 3 month time frame, RSI of previous day was in the oversold range of <30
- In 3 month time frame, MACD negative divergence is peaking and then tending towards zero
- Entry
- In the 30 day chart, sales volume is less than 10 day moving average
Proper timing of entry could result in a lower denominator to work on for the targeted 5% gain. This would result in overall lower holding period in positions.
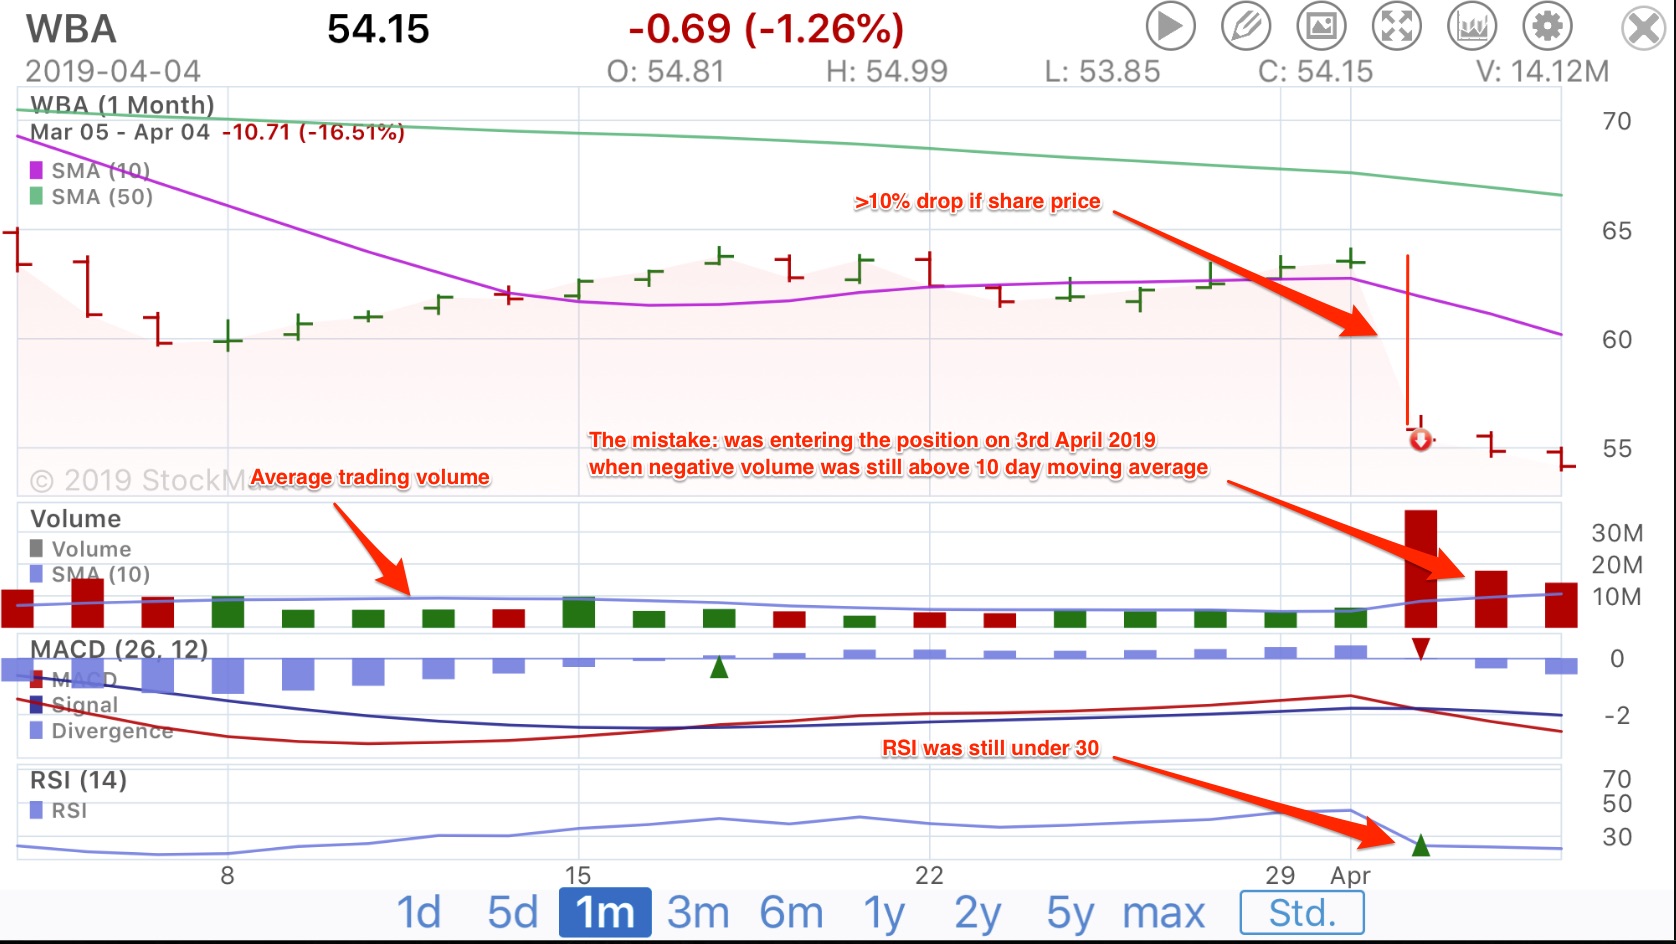
Failed attempt type 1: Entering too early
Depicted is an example of entering the position too early
- Dip classification
- >10% drop in share price
- RSI of previous day was in the oversold range of <30
- Entry
- In the 30 day chart, negative sales volume was still more than the 10 day moving average
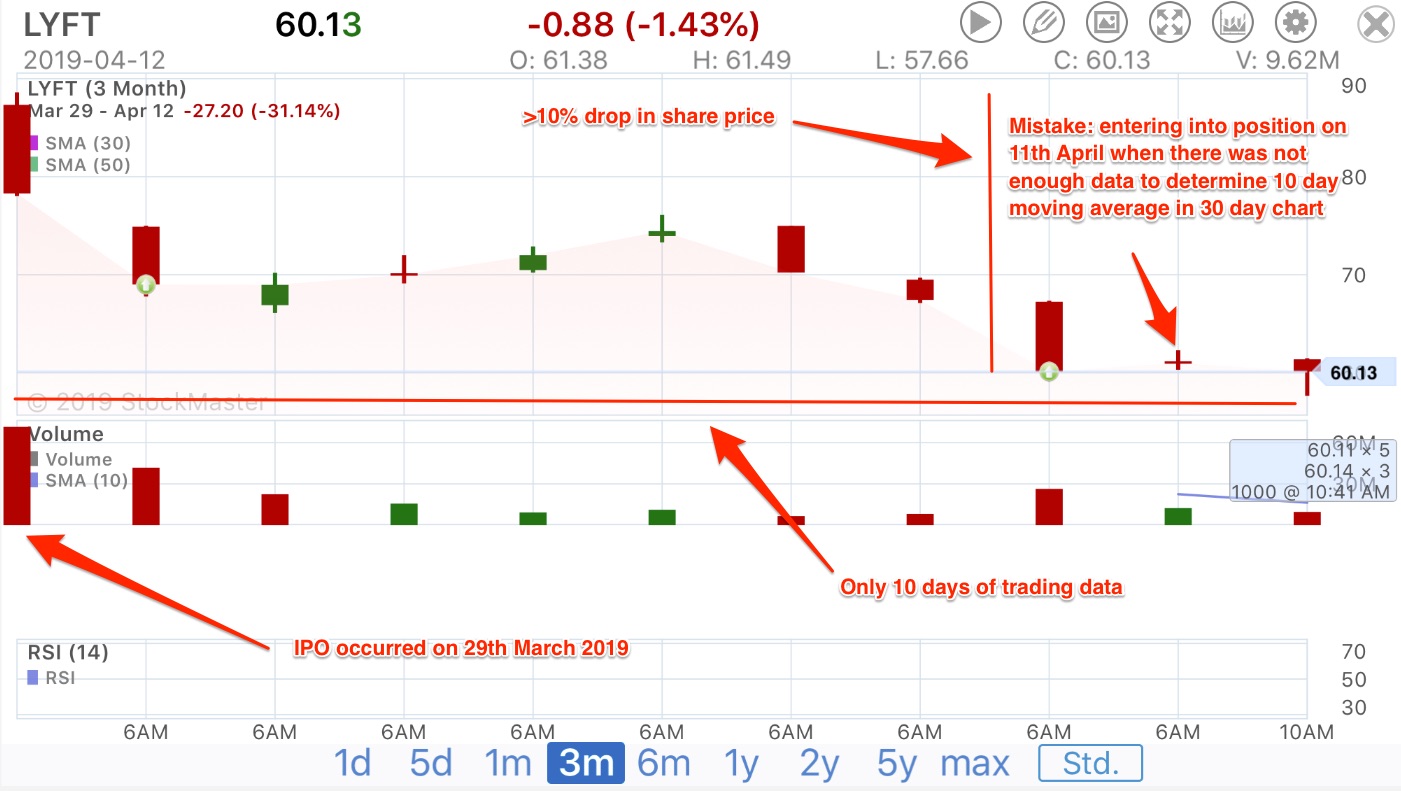
Failed attempt type 2: Trading companies with too recent IPO
- Dip classification
- >10% drop in share price
- No RSI available
- In the 30 day chart, there was not enough data to plot the 10 day moving average
To check if price recovery is due to covering of prior shorts
Failed attempt type 3: Trading companies with a steady and consistent down trend and negative fundamental news
- Dip classification
- >10% gradual drop in share price
- Continuous downtrends observed during 6 months, 3 months or 1 month window.
Failed attempt type 4: Trading companies with a steady and consistent down trend and negative macro news
- Dip classification
- >10% gradual drop in share price
- Continuous downtrends observed during 6 months, 3 months or 1 month window.
Failed attempt type 5: Trading companies with a steady and consistent down trend and negative macro news
- Dip classification
- >10% sharpe drop in share price
- Continuous downtrends observed during 6 months, 3 months or 1 month window.
Related references
- Trading strategy capitalizing on loss aversion and reversion to mean, Gary Teh
- Swing trading for dummies
- Quantitative momentum
- Short Interest checker
- IEX api – useful for pulling intra-day data
- Swing trading for dummies, Omar Bassal
- Probability theory: expected value


