Trends associated with GetData.IO

Alternative Data

Robotic Process Automation

Analysis of the Facebook Libra Token

High level

  • The launching of Libra Token will allow large swath of people access to banking
  • It will also allow corporations with a huge stock pile of cash the access to alternate forms of investment

Libra currency liquidity

Every Libra token that gets created is backed by a reserve of real assets. Close examination of partner balance sheet figures shows approximately USD148 billion dollars of cash and equivalent available for deployment right out the gates.

Libra social impact

One of Libra’s goals is to provide banking access to segments of the world’s population that don’t. Close examination of partners’ reach to this segment of the world shows 7.9million people. This is not including the 204 million African Internet Users on Facebook.

Related References

20190619 – Federal reserve chairman Powell’s speech

Federal Reserve’s two pronged mission

  • Maximum employment
  • Price stability at 2% inflation

Indicators utilized to proxy inflation

  • Unemployment levels
  • wage levels
  • consumption levels
  • Agriculture
  • manufacturing
  • Business investments
  • trade levels

Departments overview

US treasury and Federal Reserve are non-political entities

  • Government
  • US treasury – controls exchange rates
  • Federal reserve focus on domestic concerns only

Observations

  • will not act on sentiment driven from cross currents like Trade war and China’s deleveraging
  • will wait to see more of how trends pan out before acting
  • most countries find it challenging to sustain a 2% inflation rate
  • wage level increases has remained subdued despite increase demand for labor
  • balance sheets of banks are well stress tested
  • balance sheets of non-banks like mutual funds are not well tested

Effects of Trump administration and Federal Reserve fiscal policy on the S&P index

2018 Oct / Dec SPY decline

During the period of Dec 2019, the SPY index ranged between

  • 3rd Oct 2019 – USD 291.72
  • 24th Dec 2019 – USD 234.34

The steep decline in share price can be attributed to the ongoing trade war wage by the Trump administration and the expected Federal Reserve rate hike. The decline attributions are as follows:

  • Trump administration
    • USD 291.72 – USD265.37
    • 3rd Oct 2019 – 13th Dec 2019
    • decline of 9.03% off of USD291.72
  • Federal reserve rate hike
    • USD265.37 – USD234.34
    • 13th Dec 2019 – 24th Dec 2019
    • decline of 10.63% off of USD291.72

2019 May / June SPY decline

During the period of May and June 2019, the SPY index ranged between

  • 3rd May 2019 – USD 294.03
  • 3rd June 2019 – USD 274.57

The steep decline in share price can be attributed to the two front trade war wage by the Trump administration which caused a 6.61% price decline

Of the recovery that occurred after 3rd June 2019, the following parties could be attributed

  • Federal reserve
    • USD274.57 – USD 287.65
    • June 3  2019 – June 7 2019
    • 4.76% recovery off of USD274.57
  • Trump administration
    • USD 287.65 – USD 292.32
    • June 10th 2019 – June 18th 2019
    • 1.70% recovery off of USD274.57

Conclusion

While both the Government administration and the Federal reserve have observed impact on the SnP index, it is observed the Federal reserve has a slightly higher level of impact.

  • Oct/Dec 2019: 10.63% versus 9.0%
  • May/June 2019: 4.76% versus 1.70%


Non-purchase of DOMO despite 10% dip

11th June 2019 DOMO 10% share price dip

Reasons for non-purchase

  • Macro economic environment is still uncertain given US/China Trade war where leaders are set to meet during the 28th-29th June 2019 G20 Osaka summit.
  • US Treasury yield curve is currently inverted signaling a forthcoming recession
  • DOMO share price has been on a steady trend for past 3 months.
  • Competition purchases
    • Google has recently purchased Looker
    • SalesForce has recently purchased Tableau
  • Financials
    • Cash and cash equivalent is down by more than 50%
    • Total assets is down by more than 10% while total liabilities is down by only 3%

Related References

  • https://www.fool.com/investing/2019/06/07/why-domo-shares-plunged-today.aspx
  • https://www.globenewswire.com/news-release/2019/06/06/1865628/0/en/Domo-Announces-Fiscal-2020-First-Quarter-Financial-Results.html

Macro-economics negative spiral leading indicator

Overview

This post documents how we identify negative macro downtown.

Heurisitics

  • When more than 20 companies within the mega cap area experience large dip within a week, it is a good indication that macro economics trend has shift
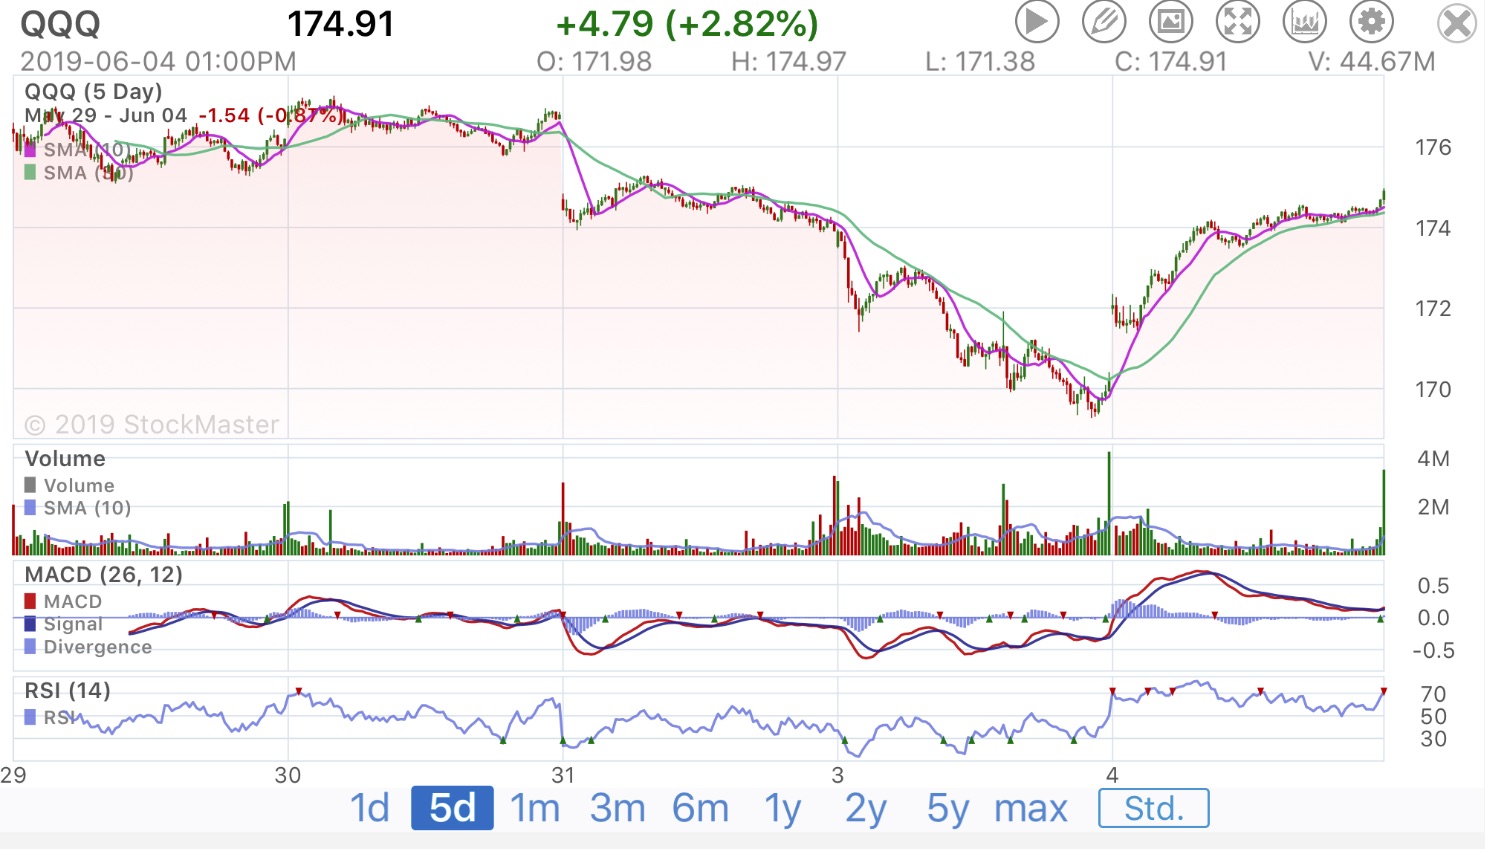
  • Verify by cross referencing with SQP, QQQ and ^RUT
  • During this scenario, it might make sense to shift position into SRTY

Related references

June 4th 2019 US/China trade war loss aversion reversion to mean pattern

Overview

The central banks announced they stepped in to prop up the market if situation deteriorates with the ongoing trade war.

The world’s leading indicator

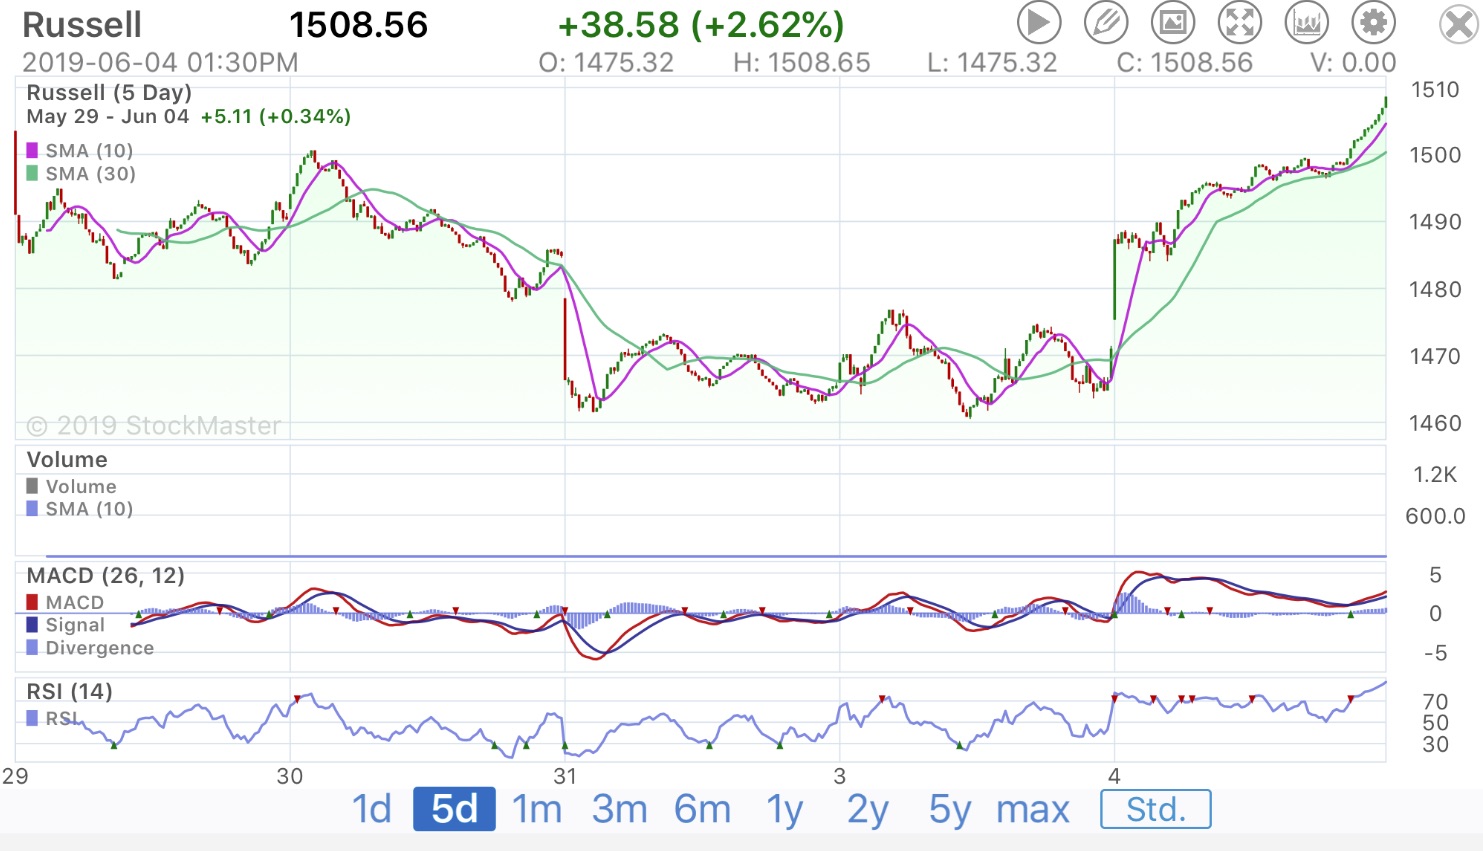
The Russell index observed to have started stabilization as recent as the 31st of May 2019

The trend followers

Down trend persisted for the Nasdaq well till 4th June 2019

Down trend persisted for the S&P 500 well till 4th June 2019

The leading indicator for Asia

The Nikkei Index closely mirrored the Russell 2000 index

Other Asian indexes

The charts for the Asian markets closely mirror the SnP charts with Singapore being most responsive amongst

Learnings on shorting the market during the May 2019 US/China Trade war

Overview

  • As with micro-trend, first determine if the root cause of the negative macro trend is structural as opposed to transient
  • When trading on macro trends it is definitely more efficient to utilize industry wide indexes as opposed to individual stocks positions. This is due to the noise within the channel when dealing from micro events.
  • Next step is to consider the exit strategy for an index position

Shorting outcome for 2019 US/China trade war

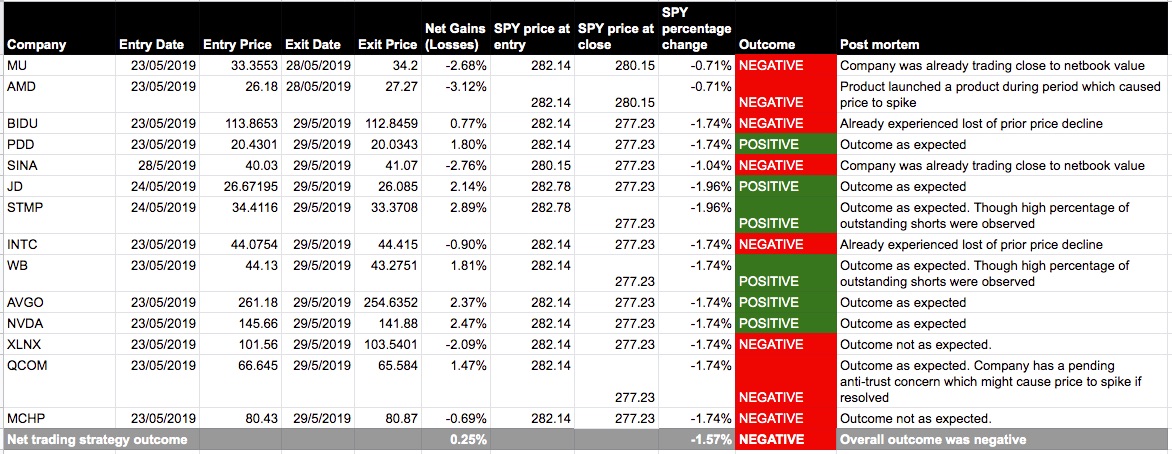
Below are a list of transactions on the short side of the market with the attempt to ride this negative macro trend.

Positions were picked based on occurrences of large dip scenarios in the prior few weeks.

This strategy under performed when compared against simply shorting the SnP index during the same period.

Related references